What do children need to know in order to use data? This handout describes:
- the foundational concepts of data,
- the importance of context in understanding the questions and problems that data can solve, and
- how young children can represent and interpret data.
 What is data? At the simplest level, it is information that we collect (knowingly or otherwise) about the world. In order to make this information useful, humans need to be able to classify, sort, organize, represent, and interpret it.
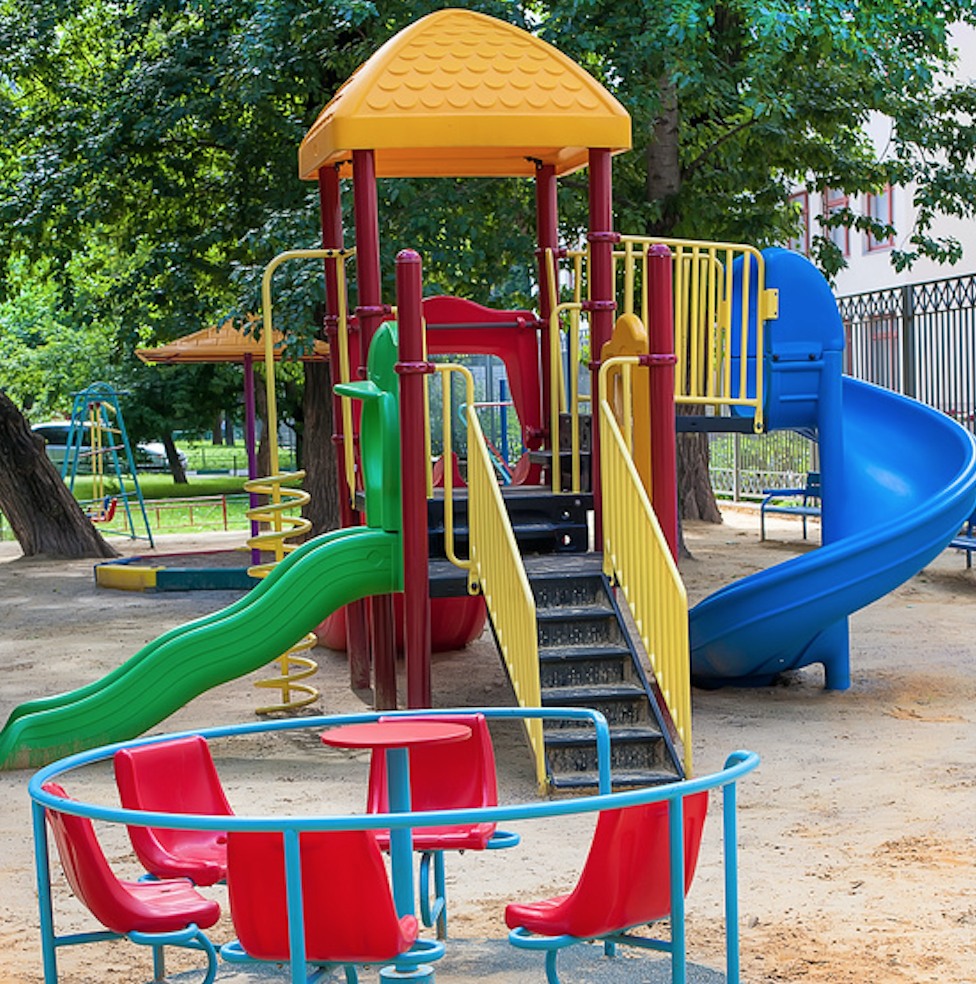
Our brains collect information constantly. This massive collection of data informs all aspects of our lives, from knowing which objects to handle carefully (if they are steaming, come from an oven, have been sitting in the sun...) to knowing which activities require hanging on (playing on a merry-go-round, swing set, and sliding poles).
Although our brains are collecting and organizing data constantly, making use of data to answer specific questions or solve problems requires bringing this collection and organization of information to a conscious level and examining it deliberately. We sometimes call this data analysis. This process is at the heart of the scientific method (see The Mathematics of Data).
So what do children know and need to know about data?
Concepts Underlying Data
In order to make use of data, children need to be able to:
- Identify variation Examples include objects that vary by size, weight, color, usefulness, attractiveness; activities that vary according to who takes part and what is accomplished; and human characteristics such as height, opinions, and roles.
- Classify information Examples are color, function (objects with spouts are good for pouring; objects with lids are good for containing contents), taste (my favorite food is ice cream); form (bicycles, cars, and trucks are all types of transportation but have different forms), shape (triangles, squares, circles), etc.
- Sort information Examples include objects that are sorted into piles, rainy days differentiated from sunny or cloudy days using icons in a weather activity, and animals divided into domestic and wild by making a list of each.
Understanding the Question or Problem
In order to figure out which data can answer questions or solve problems, children first need to understand the question or problem and its context. It can be difficult to figure out exactly what data needs to be collected. There are several considerations to bear in mind:
- What is measured—the sample Answers to some questions can be wrong because the analyst doesn't consider the entire sample. Consider, for example, the question: how many of the children enrolled in the class in Room 1 go to the park on the weekend? If some children are absent when this question is asked, and children collect data on only those who are present, their answer may be inaccurate because the sample may not represent all of the children in room. If the question is: what is Ronnie the Rat’s favorite food? an answer might be inaccurate if all food that he eats isn't considered, including when he goes home with a family on the weekends. Children frequently think about the here and now (children currently in the classroom and the meals that they see Ronnie eat), so children may need help thinking beyond the present moment in order to think about what should be included in the complete sample. In other words, are they collecting all the data that is necessary to answer the question?
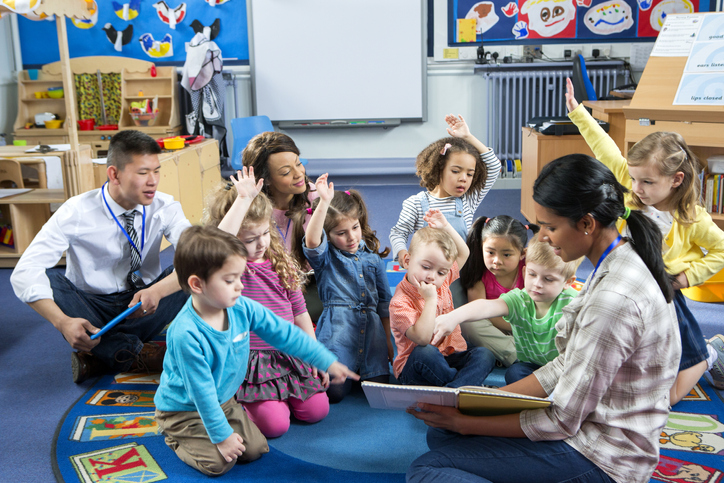
- What is measured—the variations and options What if some of the children go to the park every weekend, some of the children go to the park infrequently, and some of the children never go to the park? Children may have a hard time thinking about the universe of options because they tend to think egocentrically in such circumstances. That is, they may think only about what they themselves do and fail to realize that other children may act differently. Thinking aloud about all of the possible options before gathering the information can be useful. Creating additional categories (Who goes to the park every weekend? Who goes to the park sometimes? Who never goes to the park? Okay, who didn’t raise their hand? Do we need a new category?) might be necessary.
- The frequency of data collection If the question is how many children use the outside water table, counting children only on one day won’t provide a very good answer. What if some children use it infrequently? Although counting children using the water table for a month would give us a more accurate answer, thinking about how accurate we can be given the real-life constraints, is useful.
- The timing In the example above, collecting information on the use of the water table on days that it snows would probably not be as accurate as collecting information on a warm day (frozen water is hard to play with!). Likewise, counting in the winter how many children like to wear sandals might not obtain useful data. As noted, children tend to answer in the here and now. If it is cold in the winter, even though many children may like to wear sandals, they may not raise their hands in the tallying process because they don't like to wear sandals at that moment in time.
Representing the Data
Once data is collected, it must be put in a format that assists in answering the question or solving the problem. If the question is how many children like wearing sandals, we could count how many children raise their hands when asked “Raise your hand if you like wearing sandals,” “Raise your hand if you don’t like wearing sandals,” and “Raise your hand if you don’t care either way about wearing sandals, or don’t have sandals,” and then write the resulting numbers on the board. We could then talk about which number was greater. Alternatively, we could create a bar chart with three different bars representing the number of children providing each of the three different answers. Even if some of the resulting numbers are large, children can still engage in representing data. Tally marks can be used by children, each representing one child and grouped by answer. Then children can count the number of tallies for each answer and compare. Pictographs are also useful ways to remind children what is being counting. It is important to provide children the opportunity to decide how they would want to show someone what they had learned about the wearing of sandals, and to represent it in a way that makes sense to them.
As in measurement, the unit size is important. In a bar graph, the y-axis (the vertical line on the graph) must have consistent units. So whether the numbers represent the number of children or the number of inches of snow that falls, the distance between each number on the axis must be the same (see The Mathematics of Data for more details).
Interpreting the Findings
Interpretation is directly tied to understanding the question or problem. All questions and problems have contexts and so Interpreting the findings within the context of the question is essential. When ascertaining how many classmates frequent a park and to what extent, 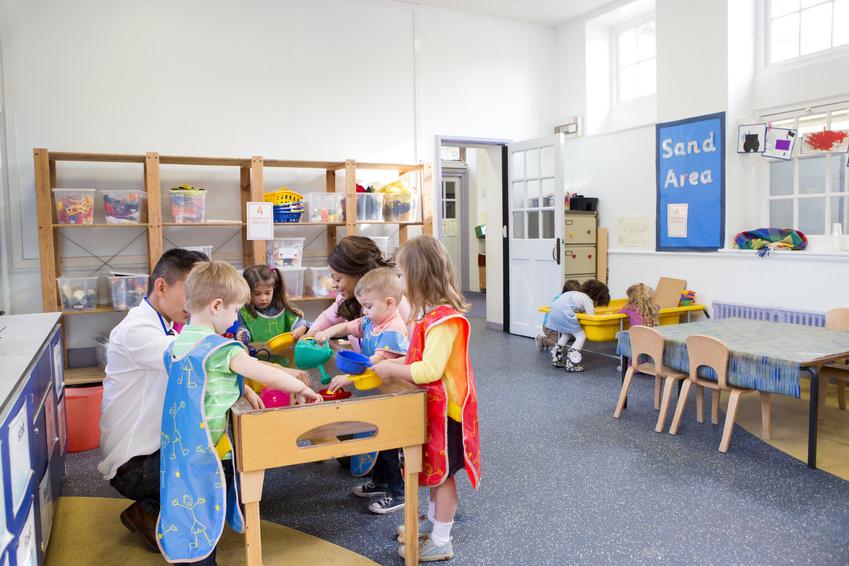 it is important for children to understand that the question and answer concern only children in Room 1 (not all of the children at the school, in the city, or in the world). When ascertaining which classmates use the water table, it is important for children to understand that the question and answer concern only the children in Room 1 who are present and get a turn at the table, only for the days that the data was collected (not over the course of a year), and only in the school’s location (not at home, at a park, or in another classroom).
In the future, all of these ideas will be built upon as children further explore the scientific method, ways to represent their data, probability and generalizability. What a terrific start they’ve got!
We know data involves math, but what does data’s math look like? This handout explores mathematics and representations used when working...
What do we mean by pattern? Can young children engage in algebraic thinking to understand patterns? How should we help young children to...
The following activities can be enacted in one class session or broken into two shorter sessions. Participants should have a good grasp of...