We know data involves math, but what does data’s math look like? This handout explores mathematics and representations used when working with data.
Important Ideas about Data
As noted in Life is a Sort of Data Gathering Activity, even before birth, infants make use of data to organize their world. Without the ability to classify and organize our world, it would be difficult, if not impossible, to make sense of it. The sections below describe some of the important concepts involved with data and its use.
 Classifying and Sorting
Although we may not think of classifying and sorting as the first steps in data analysis, sorting and classifying are at the root of data representation. If we don’t organize our data before we gather it, representing and analyzing can be difficult. As teachers know, if children are voting for which book to read during circle time, it makes much more sense to collect a list of titles on the board and have children vote on each title rather than having them all call out their favorites. Without sorting the votes (voting for them one at a time), it would be hard to sort out the winner (pun intended!).
Comparing
As with measurement (see The Mathematics of Measurement), comparing is an important concept in data. Even before they are able to count or measure, children compare the general sizes of objects and sets of objects through estimation, and use this information to make decisions (“Do I need to get more Play-Doh to have enough for my star cookie cutter, or do I have enough?”) and answer questions (“Does Michael have more cars than me?”).
Counting
More precise than estimation, counting allows us to make comparisons more accurately. Children initially connect enumeration with concrete objects (“Michael has three cars and I have five. I have more than he does!”). Eventually, solving more abstract questions around quantity is possible (“What if Michael had three cars and you had five, who would have more?”). Counting is also necessary for precise measurement of quantitative attributes, like the number of inches or sides.
Measuring
Measurement is also more precise than estimation. Whether using non-standard or standard measurement tools (see The Mathematics of Measurement for definitions) measuring can provide young children with the data needed to solve problems more accurately. If we want to know whether the new seedlings have grown over the long weekend, we’ll need measurements of their height before and after.
Representation of data
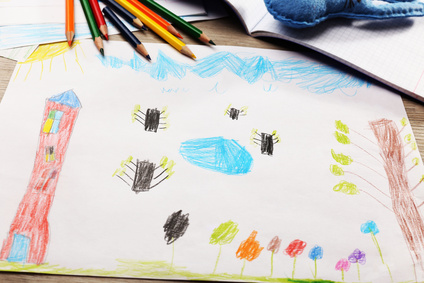
Even at a very young age, children represent data. As children begin to draw faces, they encode the data in their drawings. There are two eyes, two ears, two eyebrows, one nose and one mouth on each face. These early representations are conscious efforts to translate data from one medium to another (e.g., their sister’s face to a drawing of her face). Children may go on to record the quantity of a set of objects (see Representing Collections) by drawing the objects or using tally marks. Later, they may record the numeral. All of these efforts are ways of representing data. Preschool teachers can provide even more formal forms of data representation through the use of picture and bar graphs, pie charts and the like.
Origin
As noted in The Mathematics of Measurement, as a rule of thumb, measurement (including data) is more accurate if there is a common origin. What this means for graphs is that all pictures in picture graphs and bars in bar graphs must begin at zero on the y-axis (at the bottom line in a graph). You cannot compare the length of two strings by looking at the ends if they do not start at the same place!
Unit size
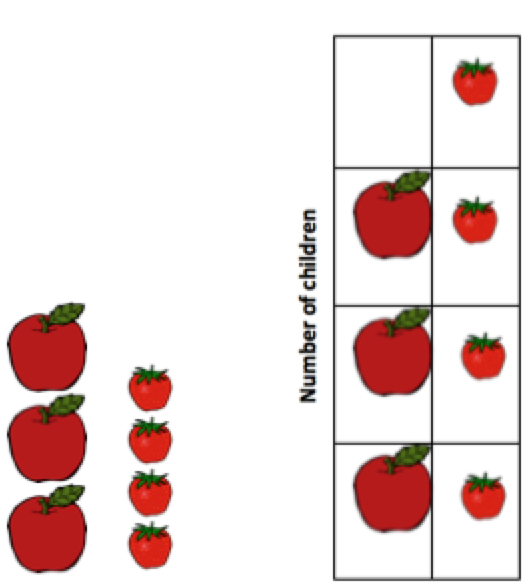 Imagine you are creating a graph and you are asking children to vote for their favorite fruit. Some of the children say strawberries and the rest say apples (yes, an unusual classroom, but bear with me). You create a picture graph with life size felt versions of the fruit and attach them to the felt board, carefully stacking the apples top to bottom and the strawberries top to bottom, ensuring they have a common origin, thus to create two bars of a bar chart. As you can see by the apples chart, unit size matters. The data that needs to be represented is the number of children, not how much fruit. So, every unit in both columns needs to be the same size (for one child equals one child, no matter which fruit they prefer). In the column representation, the number of children who prefer apples and the number who prefer strawberries is more accurately portrayed.
Solving Problems and Answering Questions with Data
Systematic data collection and analysis is a very useful tool. We use it all the time, solving simple problems (“What should we have for dinner?”) and complicated problems (“What is the number of seeds I need for a particular crop yield?”). The steps outlined in the example below can help you think about how children and teachers can use systematic data collection and analysis to solve problems.
Understand the question
The first step in this process is to understand the question or problem. For instance, let’s say that it seems that some children don’t get turns on the seesaw. That’s a problem for sure, but what is the specific question that will help us solve it? In a general sense, we want to know why children don’t get turns. So what data do we need to collect?
Form a hypothesis and collect appropriate data
The children report that the seesaw is a popular activity, resulting in some children waiting in line so long that they don’t get a turn during outside play. To test this hypothesis, we could tally how many children get to use the seesaw during outdoor play, and if there are a lot, maybe it is indeed a popular activity and we need to somehow regulate it. But, do we only need data on how many children play on the seesaw? What if it is only a few children, does that mean we don’t have a problem?
Perhaps, we also need to know the amount of time each child spends on the seesaw. It could be that the seesaw isn’t really that popular, but the children who engage in the activity stay for a long time. Maybe we should keep track of how much time children spend on the activity? And, perhaps also keep track of how many children stand in line (and apparently give up waiting and leave!) As you can see, determining what data to collect is important. Let’s say that ultimately, we decide to collect data on how many children use the seesaw, how long they use it, and how many want to use it but can’t. This will better answer this question than just the number of children seesawing.
Test the hypothesis
So, is the seesaw such a popular activity that many children don’t get to play on it? In order to test this hypothesis, we need to organize our data. We create a bar graph that lists the names of the children who seesawed on the x-axis (the horizontal line at the bottom). We then mark minutes (up to 20!) on the y-axis (the vertical line). Then we draw a bar for each child which representing how long they stayed on the seesaw. On further consideration, we also add the names of the two children who stood in line and didn’t get a turn to play. There isn’t a bar for either of them because they didn’t use the seesaw for any amount of time.
Analyze the data
So, what does the graph show? Does it confirm the hypothesis? Well, it appears that only six children either used or waited to use the seesaw. Of those children, four had really long turns, and two had no turns. With this data, it appears that the seesaw isn’t really that popular (as measured by children using or waiting to use it). But it appears that the turns are really long. However, can we really be sure that the seesaw isn’t popular? What if other children gave up long ago on getting turns and don’t bother to stand in line anymore?
Sometimes analysis presents the need for more data collection
So we now have a new question: if children now know that they might eventually get a turn, will the seesaw become more popular (as measured by children using and trying to use it)? We establish a time-limit for turns at five minutes and collect another set of data. In the end, we finally determine that seesawing isn’t really popular, but there are a few children who really love to seesaw for a long time!
We often think of graphs and charts when we think of data. But children collect data all the time without them. This handout describes the...
An accessible overview of the mathematics of geometry and spatial relations. This article contextualizes this mathematics in children’s...
The following activities can be enacted in one class session or broken into two shorter sessions. Participants should have a good grasp of...