These tasks are designed to help you assess a child’s understanding of data. The protocol begins with sorting and reading simple graphs and moves on to creating graphs.
Revised March 30, 2019
The tasks in this protocol can help you answer questions about a child’s understanding of sorting and graphing. Here are three ideas that can be explored:
- There are many ways to sort and categorize a group of objects.
- Data can be collected and graphed to answer questions.
- Tallies, bars, and pictures can be used to show and interpret data.
The resource Math Thinking Conversations provides guidelines for how to use these kinds of tasks to explore a child’s mathematical understanding.
The tasks that follow have been organized according to the questions listed above. For more assessment tasks that can be used in conjunction with, or in addition to, the tasks below, see Data Assessment Protocol: Additional Tasks (download below). Select video examples of assessment items are available in Data Assessment Videos.
Sorting and Categorizing Objects
- Identify categories of data Provide the child with items that are clearly different based on a visible attribute, such as color, shape, or type of object. Ask the child to identify ways to sort the objects. Here are some ideas:
- Differently colored connecting cubes that are the same size Ask, "How are these cubes the same? How are they different?" Pay attention to whether or not the child recognizes that the objects all have the same size and shape, but are different in color
- Different shapes (e.g., attribute blocks that differ in shape, color, size and thickness) Ask, "How are these alike? How are they different? If I wanted to sort them into different groups, how could I sort them?" Pay attention to whether or not the child suggests sorting by shape or another attribute.
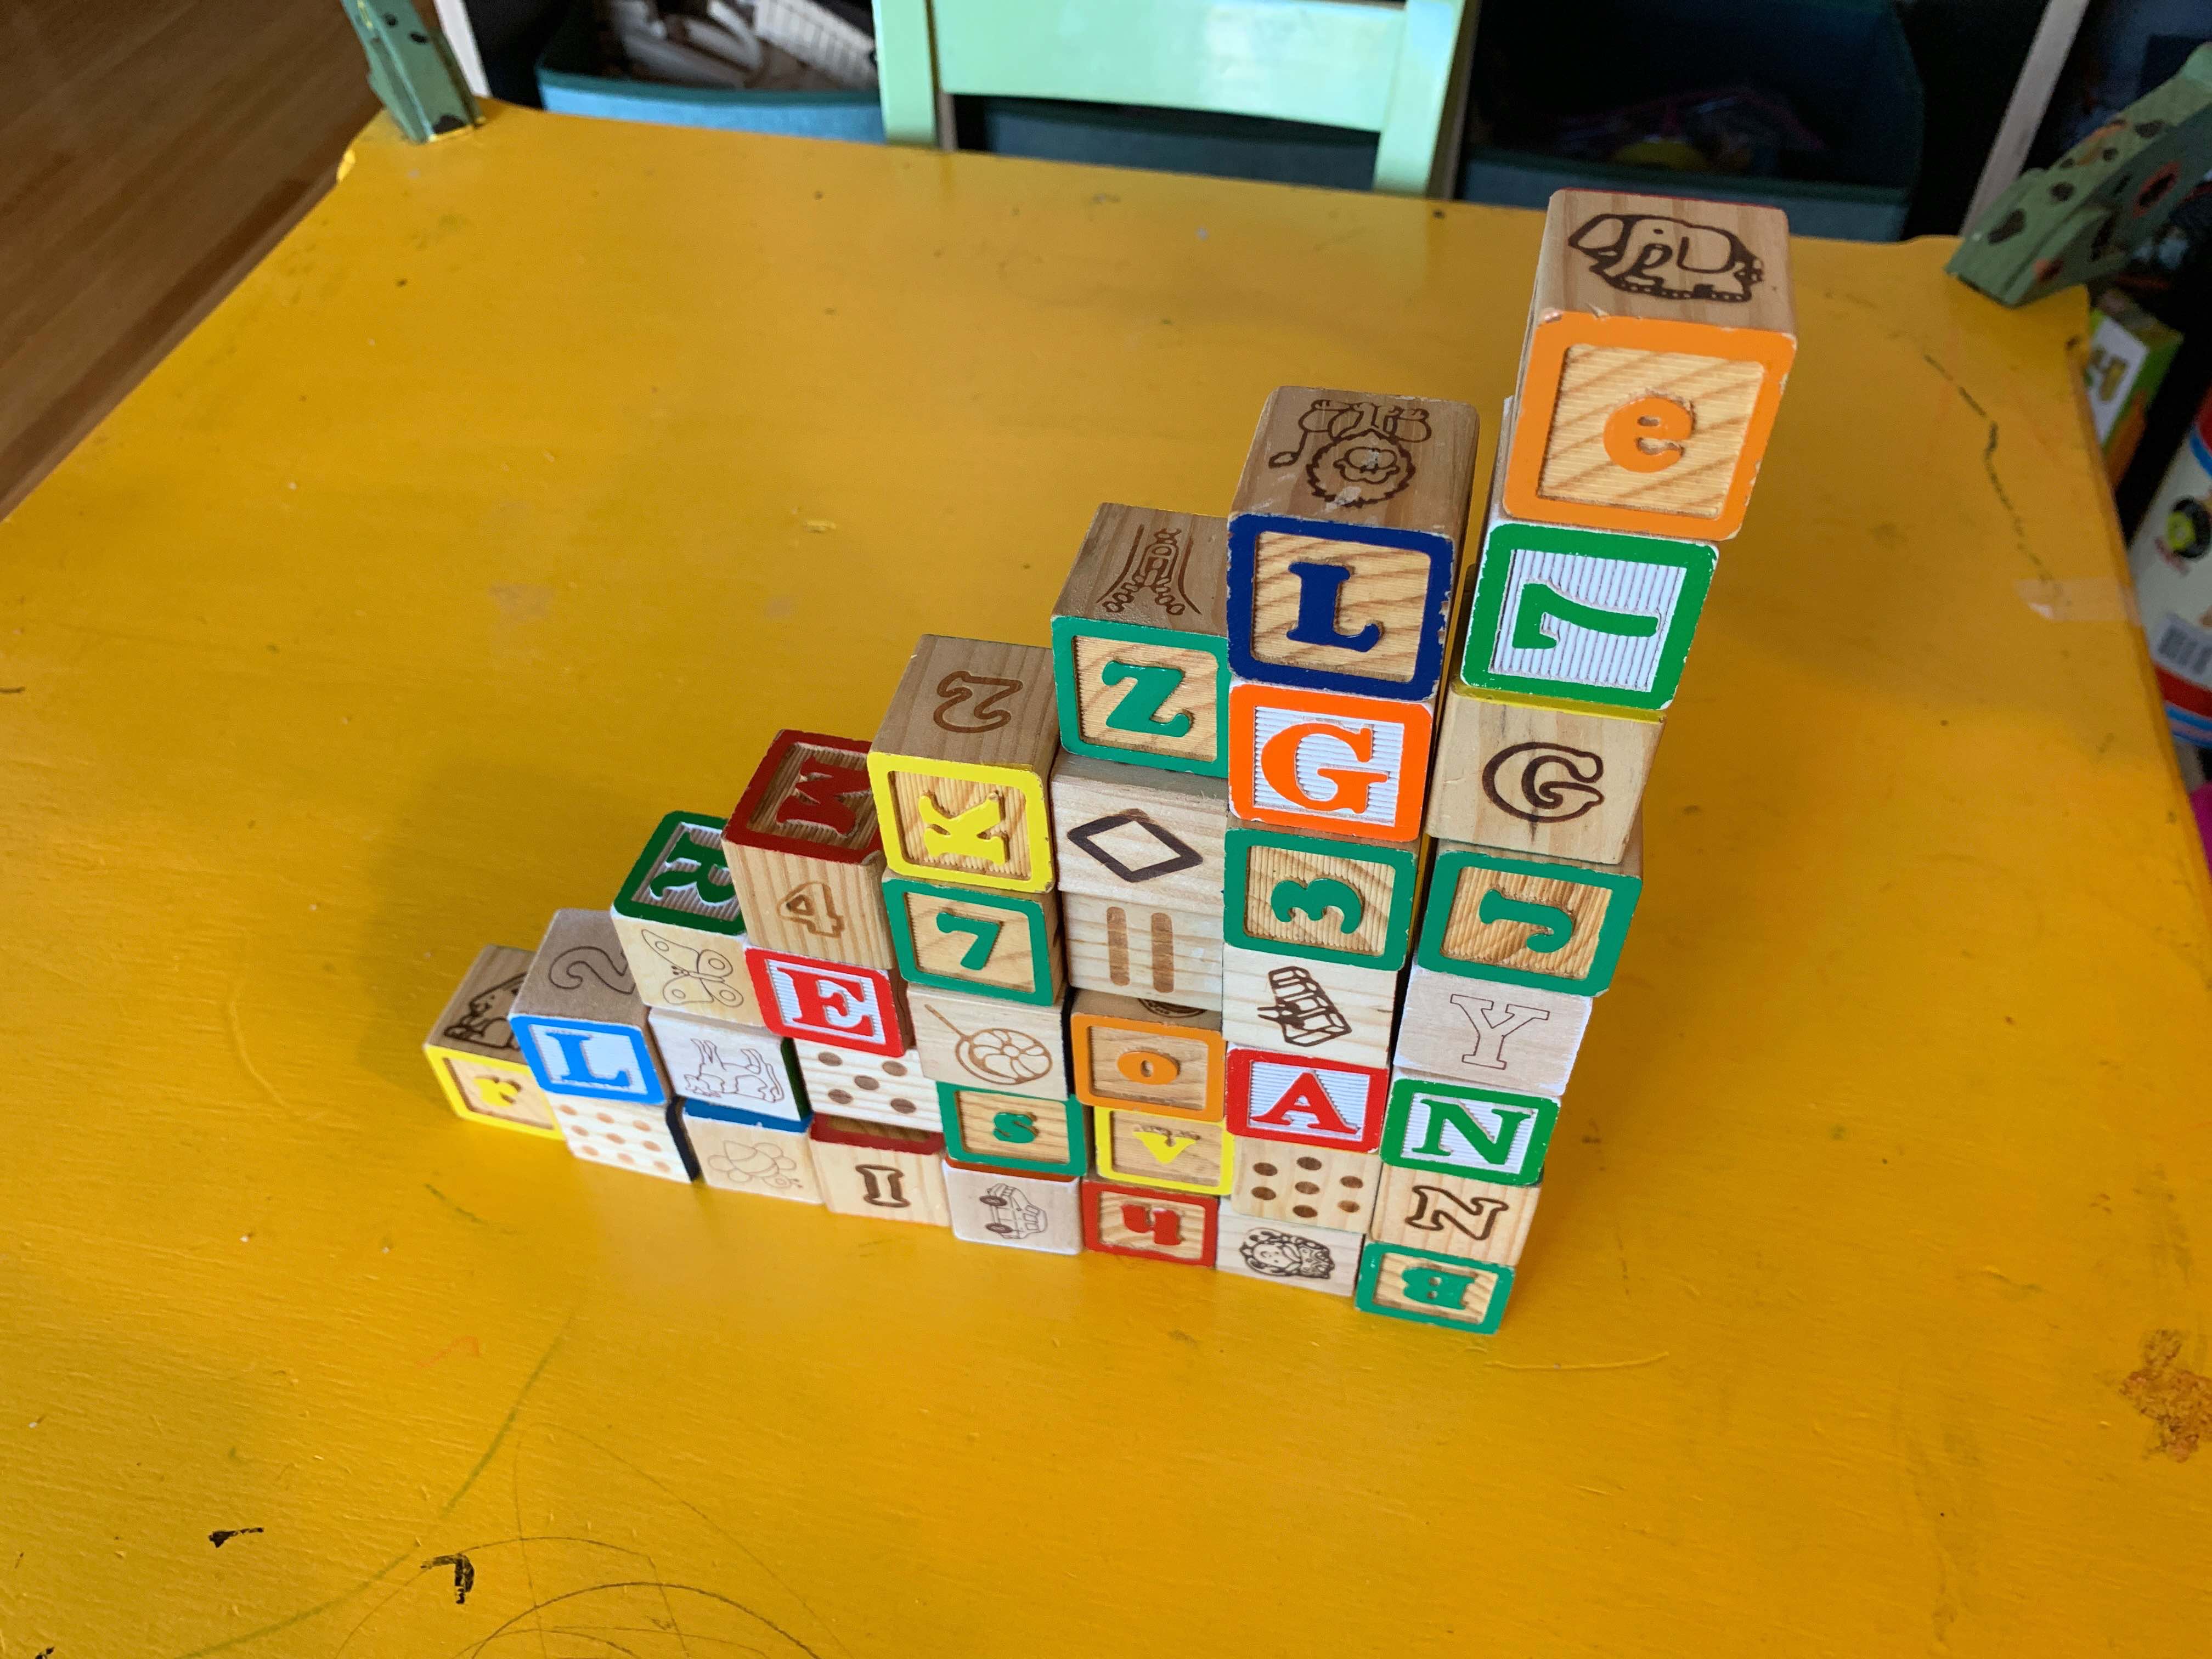
- Mix of different types of objects. For example, use bears, cubes, triangles, and rhombuses all together You can introduce this using a familiar concept, such as organizing toys. Say, "These are my mixed up toys. I want to organize them. I want to put my toys into the right piles. How can I do this?" Pay attention to the categories the child suggests. If the child suggests only two large categories, (e.g., bears and shapes), you can accept those groups or ask the child if the shapes group can be subdivided further. "What if I want to organize this group [one of the two large groups] more? How could I do that?" See if the child then subdivides them further. Watch Michael: Categorize here and Danielle: Categorize & Sort here.
- Sort objects into groups Ask the child to sort objects based on the categories he identified previously. For younger children, you might want to suggest simple categories like colors or shapes. Pay attention to how the child sorts and any strategies the child uses. For example, if sorting by shape, does the child gather all of the triangles and then move on to gathering all of the squares, or does the child pick up objects one by one and place them in piles? Does the child place them in a group, line them up, or stack them? Does the child miss any objects? For example, if you have both large and small triangles, does the child sort only the large ones and forget about the small ones? Scaffold if the child needs some assistance with the task. Watch Alice: Sort here.
Using Graphs to Answer Questions
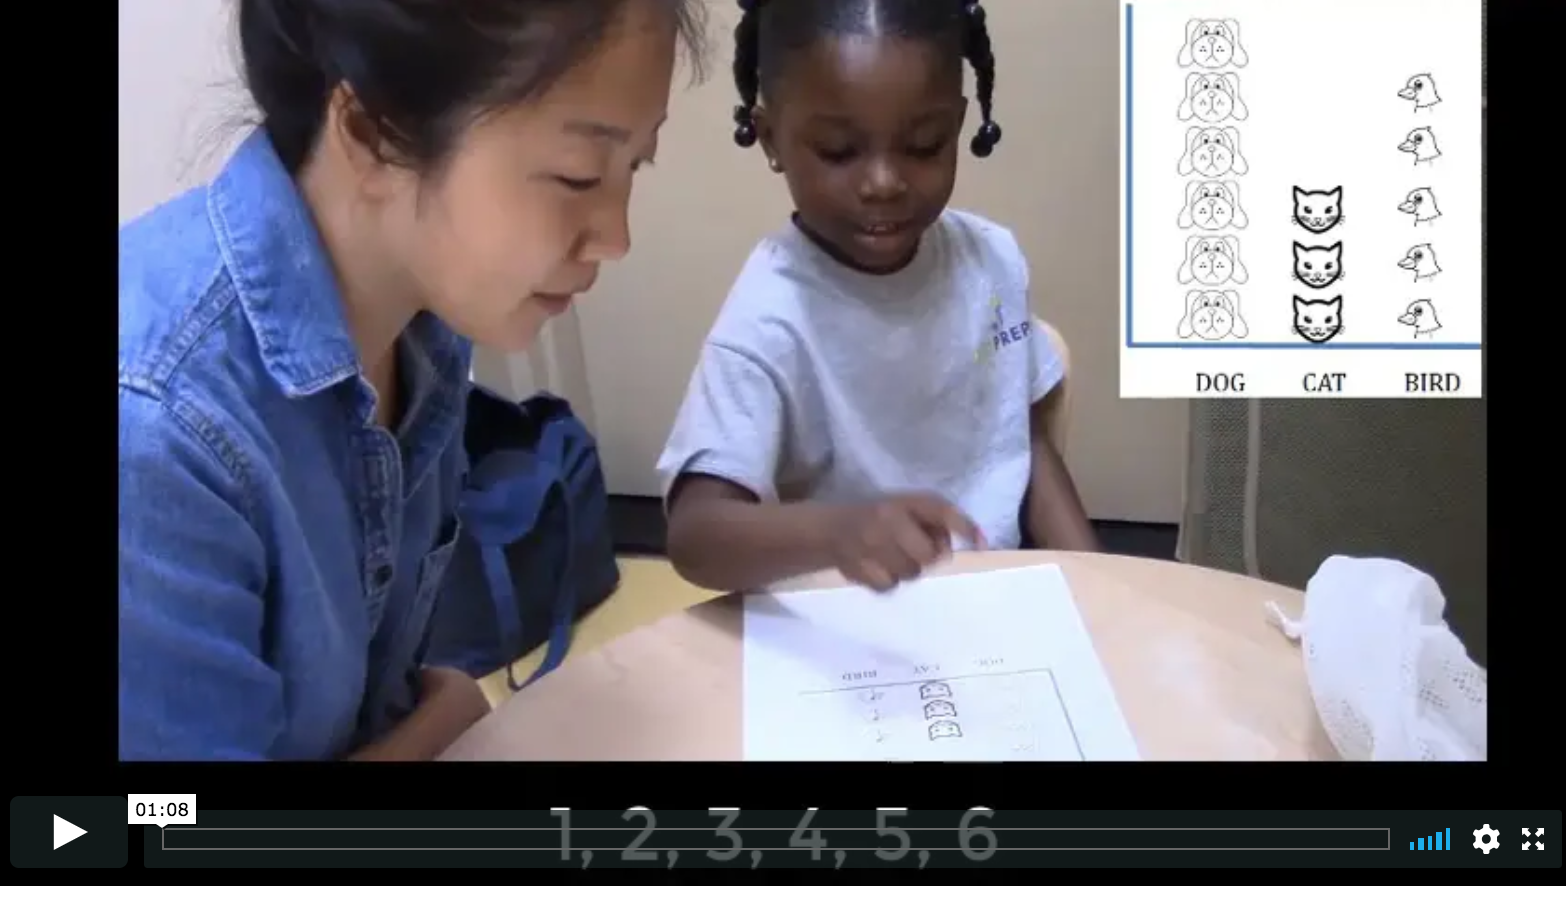
- Read a picture graph Present a simple picture graph with pictures of animals or other objects that are easily recognizable. Say, "What does the graph show you?" See if the child identifies the categories (e.g., dogs, cats, and birds), counts the number in each category, or suggests other interpretations. If the child misinterprets the graph, for example, saying the pictures show how tall the pets are, pose questions to see if the child can view the graph another way. Watch Erica: Read a Picture Graph here and Michael: Read a Picture Graph here.
- Use the graph to answer questions Ask questions that require the child to read or interpret the graph. Here are some examples based on the graph above:
- "How many dogs are there?"
- "Are there more dogs or more cats? How do you know?"
- "How many more birds are there than cats?"
- "Which group has the most animals? Which group has the least?"
- "What if I put one more dog on the graph? How many dogs would there be then?"
Creating Graphs
- Label a graph/chart After the child has sorted objects into different categories, ask how he would show how many are in each group. He might use tallies or other methods. Then present some blank rows or a blank grid. Say, "I want to make a graph [or chart] to show how many are in each group. How could I do that? How could I label this row [or column]?" You will likely have to show the child what these words (row and column) refer to. Draw pictures to show the labels suggested. Decide if you will take an open-ended or guided approach to creating the graph.
- Create a graph/chart (open-ended) After the rows or axes are labeled, ask the child, "How could we fill in this graph [or chart?]" Provide the rows or grid lines and a marker. Here are some possibilities. The child may write numerals, draw tallies, draw dots, color cells on a grid, draw pictures, or even place objects along the grid. Follow up by asking the child to explain how the graph/chart shows how the objects were sorted. If the child did not create an accurate graph/chart, ask questions to see if she recognizes any flaws. Watch Holden: Create a Graph here and Michael: Create a Graph here.
- Create a plot on grid paper (guided) Ask the child to count the number of objects in each group. Encourage the child to draw dots in the cells to show the total. It may help to scaffold the child and help her count the number of squares she needs to mark before actually marking them. Some children may need help remembering the number they are representing and/or may get carried away and fail to stop when they reach the correct number of dots. Ask her how she can check to make sure she has the right number of dots for each object. Watch Danielle: Create a Plot here.
Sarama, J., & Clements, D. H. (2009). Early childhood mathematics education research: Learning trajectories for young children. New York: Routledge.
This page consists of video clips that are designed to illustrate assessing students using the data assessment protocol.
These tasks are designed to help you assess an individual child’s understanding of patterns. The protocol begins with relatively simple...
The following activities can be enacted in one class session or broken into two shorter sessions. Participants should have a good grasp of...