Often when working with data in preschool, teachers collect or ask children to collect survey data (months of birthdays, favorite color). The activity described here will help teachers to consider how to use observation data to promote engagement and learning in mathematics in ways that are authentic, purposeful, and interesting for students.
by Megan Franke
Activity for Teacher Educators
Opening Move: Noticing Different Kinds of Data
Share the three images below with your participants. Ask participants what they notice about the data representations in these images: How are they the same or different?
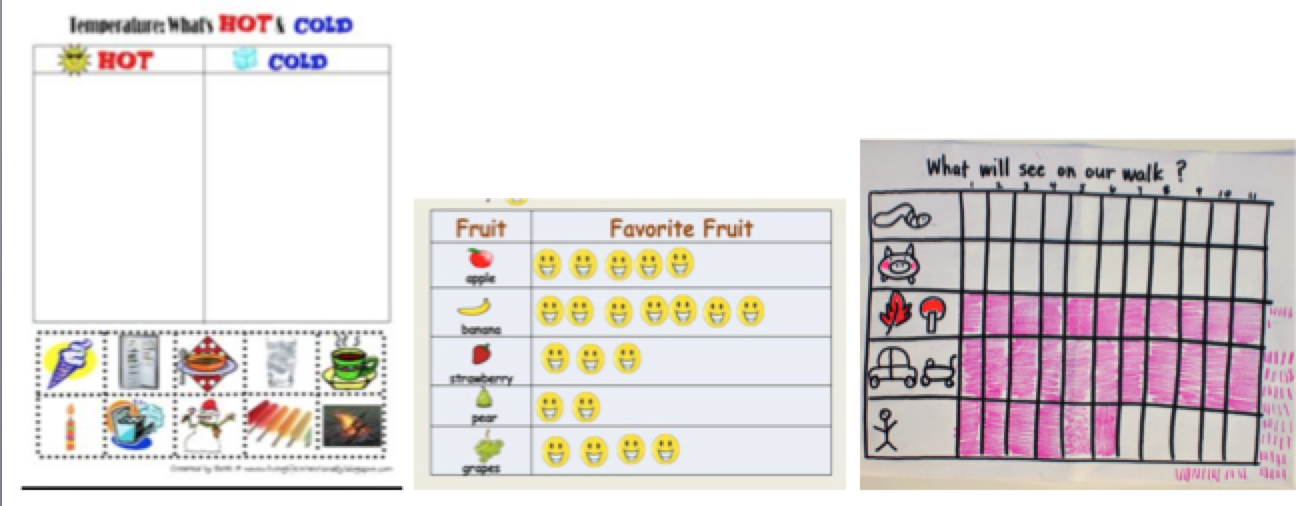
Note to TE: Only the third image (“What will we see on our walk?”) uses observation; the second uses survey.
Elicit participant responses. Participants will likely attend to a number of features (items are provided for hot and cold, happy faces are used for students, etc.) and while all the different features could lead to productive conversations, the goal is to pursue those ideas that emerge about the kinds of data displayed. In the hot/cold chart students engage in sorting; the chart does not require data collection. The favorite fruit image shows survey data, and the “What will we see on our walk?” image could be a survey or observation data as it could either have been surveying students for what they think they will see or a data collection tool that students used as they walked to keep track of what they saw. The differences across these data representations can create space to consider the kind of data collected, the questions being asked, and what kind of sense making students are asked to engage in.
Follow-Up: Another Data Example
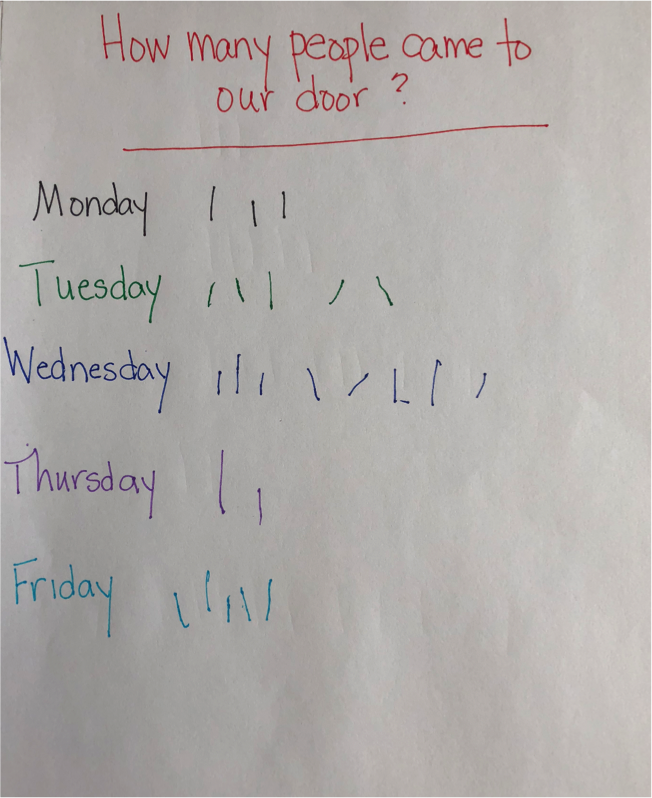 Show participants another image. This image shows students tracking the number of people who come to the door during the school day. Every time someone came to the door a student would make a mark on the board. Ask participants how the data are the same or different from the data on the earlier charts.
Facilitate a discussion with participants.
- Ask participants what they could ask preschoolers about this data.
- Generate questions that preschool children might be interested in that require observation data. Some examples might include: How many children walk to school? How many children do art during choice time? Do more children go to the sand area or ride bikes?
- Ask participants to consider how children might themselves keep track of their data.
- Engage participants in a conversation about supporting children to make sense of the data with minimum adult assistance.
Next Step: Taking this Back to the Classroom
Ask participants to work in small groups. Their task in small groups is to plan an activity that that involves data collection and discuss the math concepts the activity involves. Ask them to consider how they might make sure the activity is productive for children with varying levels of math understanding.
Final Note to TE. This activity can also support participants to consider how to introduce children to scientific methods, such as formulating hypotheses (which fruit do you think will be the most popular?), collecting, representing and analyzing data, and drawing conclusions (we predicted strawberries, but bananas were the most popular fruit).
This handout describes challenges children face as they learn to measure lengths using non-conventional units (in this example, connecting...

Supporting children to notice and describe what they notice is a productive way for teachers to leverage the ways in which children...
The following activities can be enacted in one class session or broken into two shorter sessions. Participants should have a good grasp of...